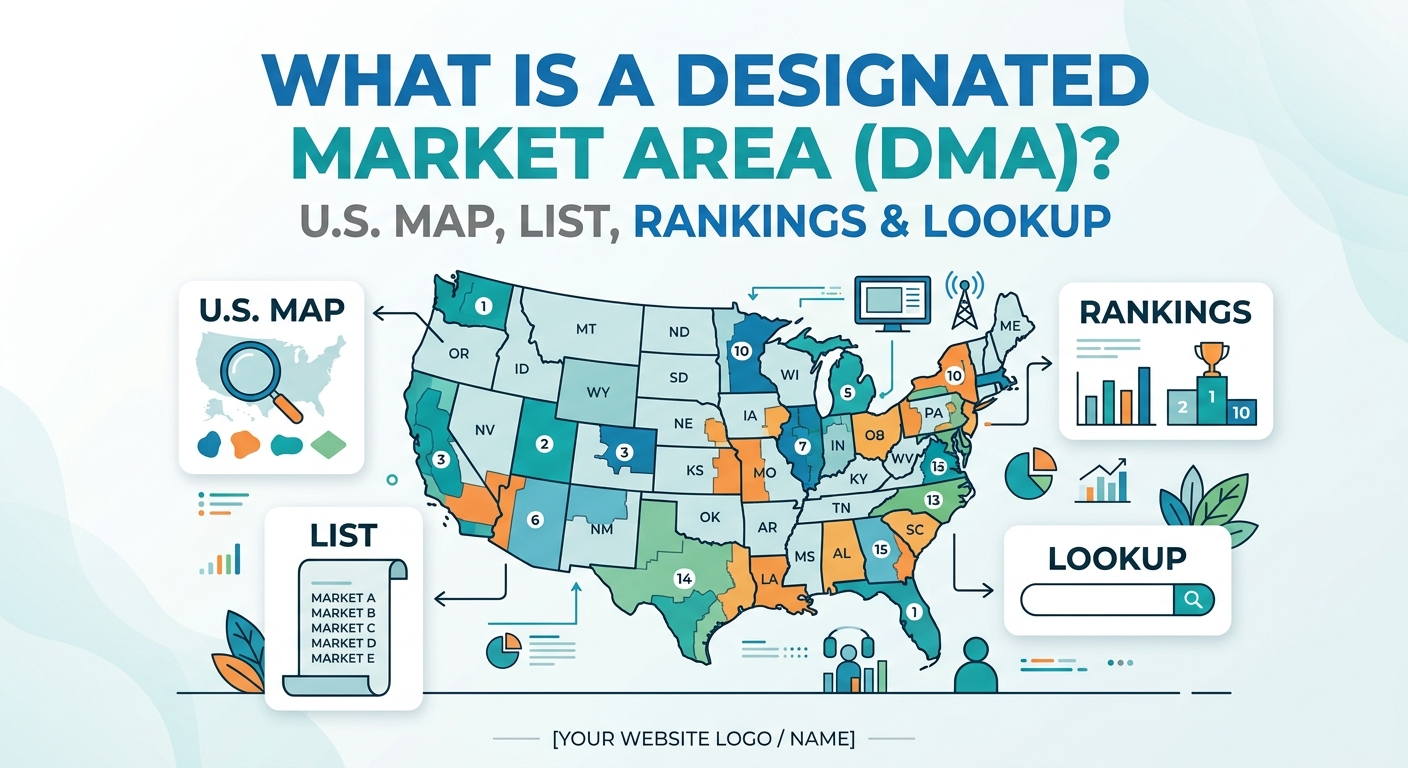
A Designated Market Area (DMA) is a geographic region used to define a local television market in the United States. DMA regions are defined by Nielsen and group geographic areas into exclusive television markets based on local viewing patterns.
There are currently 210 DMA regions in the Nielsen system, covering the continental United States, Hawaii, and parts of Alaska. DMA regions are widely used for television audience measurement, advertising, media buying, market research, and geographic targeting.
If you’re asking “What DMA am I in?”, this guide can help you find a DMA using a ZIP Code, city, or county, understand the U.S. DMA map, explore DMA markets and rankings, and learn how DMA codes and geographic boundaries are used.
What Is a Designated Market Area?
A Designated Market Area (DMA), commonly called a DMA, is a geographic region that represents a local television market in the United States.
Nielsen defines DMA regions as non-overlapping geographic areas that group counties according to television viewing patterns. A DMA identifies the local television market associated with a particular geographic area.
In simple terms, a DMA answers this question:
Which local television market does this location belong to?
A DMA is different from a city, state, ZIP Code, county, or metropolitan statistical area (MSA). While those geographic classifications serve different purposes, a DMA is specifically designed to represent a local television viewing market.
For example, a DMA can include a major city along with surrounding counties, smaller communities, suburbs, and rural areas that belong to the same local television market.
The DMA therefore describes the television market serving an area, rather than simply identifying the city or postal location where someone lives.g with surrounding counties and communities that receive and watch the same local television stations.
What Does DMA Stand For?
DMA stands for Designated Market Area.
The term is commonly used in the U.S. television, advertising, media, and marketing industries to describe a standardized geographic area representing a local television market.
You may also see related terms such as:
- DMA
- DMA region
- Designated Market Area
- television market
- local TV market
- media market
- broadcast market
In the Nielsen system, DMA specifically refers to the geographic classification used to define and measure local television markets.
How Do Designated Market Areas Work?
DMA regions are organized around local television viewing patterns, rather than simply following city, state, or other political boundaries.
The basic relationship can be understood as:
Viewers → Local TV Stations → Television Market → DMA Region
A DMA can include multiple counties, cities, suburbs, and communities when they belong to the same local television viewing market.
DMA regions are non-overlapping, meaning each geographic area is assigned to a specific DMA within the Nielsen system.
Nielsen periodically reviews DMA boundaries and may change the counties or geographic areas included in individual markets as television viewing patterns and market conditions change.
This standardized structure allows advertisers, broadcasters, media buyers, and researchers to analyze local television audiences using consistent geographic markets.
How Many DMA Regions Are There in the U.S.?
There are currently 210 DMA regions in the Nielsen system.
These 210 markets cover:
- The continental United States
- Hawaii
- Parts of Alaska
DMA regions are exclusive geographic areas used for local television audience measurement and media-market analysis.
DMA boundaries are not the same as permanent political boundaries. Nielsen can revise market boundaries as television viewing patterns and market conditions change, so the applicable DMA should always be checked against the current Nielsen data.
U.S. Designated Market Area Map
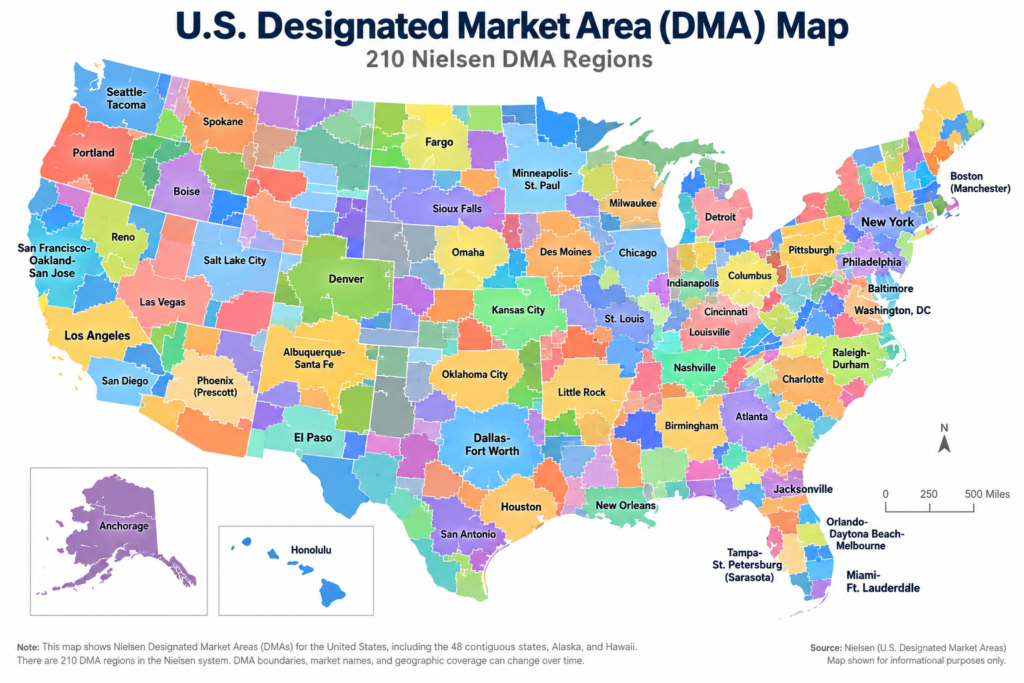
A Designated Market Area map shows how the United States is divided into local television markets.
Unlike a state map, DMA boundaries do not simply follow state lines. A single DMA can include multiple counties and communities, while its market name may be associated with a particular major city.
A DMA map can help you understand:
- Which television market covers a location
- Which counties belong to a DMA
- The geographic boundaries of a television market
- The relative size and coverage of different DMA regions
- Regional television markets used for advertising and media buying
For the most accurate results, use a DMA map based on the current Nielsen DMA boundaries, since market boundaries and geographic assignments can change over time.ns. Its DMA data also includes county boundaries and geographic information for mapping purposes.
The United States is divided into 210 Designated Market Areas (DMAs) in the Nielsen system. The following list reflects the 2025–26 television season rankings, with markets ordered by rank. Nielsen’s DMA geography is proprietary, and the applicable market definitions can change over time.
Complete U.S. DMA List: 210 Nielsen Television Markets
The United States is divided into 210 Designated Market Areas (DMAs) in the Nielsen system. The table below lists the DMA markets by ranking.
| Rank | DMA Market | Major Market Area |
|---|---|---|
| 1 | New York | New York metropolitan area |
| 2 | Los Angeles | Los Angeles area |
| 3 | Chicago | Chicago area |
| 4 | Dallas-Fort Worth | Dallas-Fort Worth area |
| 5 | Philadelphia | Philadelphia area |
| 6 | Houston | Houston area |
| 7 | Atlanta | Atlanta area |
| 8 | Washington, D.C. (Hagerstown) | Washington, D.C. area |
| 9 | San Francisco-Oakland-San Jose | San Francisco Bay Area |
| 10 | Boston (Manchester) | Boston area |
| 11 | Tampa-St. Petersburg (Sarasota) | Tampa Bay area |
| 12 | Phoenix (Prescott) | Phoenix area |
| 13 | Seattle-Tacoma | Seattle area |
| 14 | Detroit | Detroit area |
| 15 | Orlando-Daytona Beach-Melbourne | Central Florida |
| 16 | Minneapolis-St. Paul | Twin Cities area |
| 17 | Denver | Denver area |
| 18 | Miami-Fort Lauderdale | South Florida |
| 19 | Cleveland-Akron (Canton) | Northeast Ohio |
| 20 | Sacramento-Stockton-Modesto | Central California |
| 21 | Charlotte | Charlotte area |
| 22 | Raleigh-Durham (Fayetteville) | Research Triangle |
| 23 | Portland, OR | Portland area |
| 24 | St. Louis | St. Louis area |
| 25 | Nashville | Nashville area |
| 26 | Indianapolis | Indianapolis area |
| 27 | Pittsburgh | Pittsburgh area |
| 28 | Salt Lake City | Utah and surrounding area |
| 29 | Baltimore | Baltimore area |
| 30 | San Diego | San Diego area |
| 31 | San Antonio | San Antonio area |
| 32 | Kansas City | Kansas City area |
| 33 | Hartford-New Haven | Connecticut area |
| 34 | Austin | Austin area |
| 35 | Columbus, OH | Columbus area |
| 36 | Greenville-Spartanburg-Asheville-Anderson | Upstate South Carolina / Western North Carolina |
| 37 | Cincinnati | Cincinnati area |
| 38 | Milwaukee | Milwaukee area |
| 39 | West Palm Beach-Fort Pierce | Treasure Coast / Palm Beach area |
| 40 | Las Vegas | Las Vegas area |
| 41 | Jacksonville | Northeast Florida |
| 42 | Harrisburg-Lancaster-Lebanon-York | South-Central Pennsylvania |
| 43 | Grand Rapids-Kalamazoo-Battle Creek | West Michigan |
| 44 | Norfolk-Portsmouth-Newport News | Hampton Roads |
| 45 | Birmingham (Anniston and Tuscaloosa) | Central Alabama |
| 46 | Greensboro-High Point-Winston-Salem | Piedmont Triad |
| 47 | Oklahoma City | Central Oklahoma |
| 48 | Albuquerque-Santa Fe | New Mexico |
| 49 | Louisville | Louisville area |
| 50 | New Orleans | New Orleans area |
| 51 | Memphis | Memphis area |
| 52 | Providence-New Bedford | Rhode Island / Southeastern Massachusetts |
| 53 | Fort Myers-Naples | Southwest Florida |
| 54 | Fresno-Visalia | Central California |
| 55 | Buffalo | Western New York |
| 56 | Richmond-Petersburg | Central Virginia |
| 57 | Mobile-Pensacola (Fort Walton Beach) | Gulf Coast |
| 58 | Little Rock-Pine Bluff | Central Arkansas |
| 59 | Wilkes Barre-Scranton-Hazleton | Northeastern Pennsylvania |
| 60 | Knoxville | East Tennessee |
| 61 | Tulsa | Northeastern Oklahoma |
| 62 | Albany-Schenectady-Troy | Capital Region, New York |
| 63 | Lexington | Central Kentucky |
| 64 | Dayton | Dayton area |
| 65 | Tucson (Sierra Vista) | Southern Arizona |
| 66 | Spokane | Eastern Washington / North Idaho |
| 67 | Des Moines-Ames | Central Iowa |
| 68 | Green Bay-Appleton | Northeastern Wisconsin |
| 69 | Honolulu | Hawaii |
| 70 | Roanoke-Lynchburg | Southwestern Virginia |
| 71 | Wichita-Hutchinson Plus | South-Central Kansas |
| 72 | Flint-Saginaw-Bay City | Central Michigan |
| 73 | Omaha | Eastern Nebraska |
| 74 | Springfield, MO | Southwest Missouri |
| 75 | Huntsville-Decatur (Florence) | North Alabama |
| 76 | Columbia, SC | Central South Carolina |
| 77 | Madison | South-Central Wisconsin |
| 78 | Portland-Auburn | Southern Maine |
| 79 | Rochester, NY | Rochester area |
| 80 | Harlingen-Weslaco-Brownsville-McAllen | Rio Grande Valley |
| 81 | Toledo | Northwest Ohio |
| 82 | Charleston-Huntington | West Virginia / Eastern Ohio |
| 83 | Waco-Temple-Bryan | Central Texas |
| 84 | Savannah | Coastal Georgia |
| 85 | Charleston, SC | Lowcountry South Carolina |
| 86 | Chattanooga | Southeast Tennessee |
| 87 | Colorado Springs-Pueblo | Southern Colorado |
| 88 | Syracuse | Central New York |
| 89 | El Paso (Las Cruces) | West Texas / Southern New Mexico |
| 90 | Paducah-Cape Girardeau-Harrisburg | Western Kentucky / Southern Illinois |
| 91 | Shreveport-Texarkana | Northwest Louisiana / East Texas |
| 92 | Champaign-Urbana & Springfield-Decatur | Central Illinois |
| 93 | Burlington-Plattsburgh | Vermont / Northern New York |
| 94 | Cedar Rapids-Waterloo-Iowa City & Dubuque | Eastern Iowa |
| 95 | Baton Rouge | Baton Rouge area |
| 96 | Fort Smith-Fayetteville-Springdale-Rogers | Northwest Arkansas |
| 97 | Myrtle Beach-Florence | Northeastern South Carolina |
| 98 | Boise | Southern Idaho |
| 99 | Jackson, MS | Central Mississippi |
| 100 | South Bend-Elkhart | Northern Indiana |
| 101 | Tri-Cities, TN-VA | Northeast Tennessee / Southwest Virginia |
| 102 | Greenville-New Bern-Washington | Eastern North Carolina |
| 103 | Reno | Northern Nevada |
| 104 | Davenport-Rock Island-Moline | Quad Cities |
| 105 | Tallahassee-Thomasville | North Florida / South Georgia |
| 106 | Tyler-Longview (Lufkin & Nacogdoches) | East Texas |
| 107 | Lincoln & Hastings-Kearney | Nebraska |
| 108 | Augusta-Aiken | Georgia / South Carolina border area |
| 109 | Evansville | Southern Indiana / Western Kentucky |
| 110 | Fort Wayne | Northeast Indiana |
| 111 | Sioux Falls (Mitchell) | Eastern South Dakota |
| 112 | Johnstown-Altoona-State College | Central Pennsylvania |
| 113 | Fargo-Valley City | Eastern North Dakota / Western Minnesota |
| 114 | Yakima-Pasco-Richland-Kennewick | Central / Eastern Washington |
| 115 | Springfield-Holyoke | Western Massachusetts |
| 116 | Traverse City-Cadillac | Northern Michigan |
| 117 | Lansing | Central Michigan |
| 118 | Youngstown | Northeastern Ohio |
| 119 | Macon | Central Georgia |
| 120 | Eugene | Southern Oregon |
| 121 | Montgomery-Selma | Central Alabama |
| 122 | Peoria-Bloomington | Central Illinois |
| 123 | Santa Barbara-Santa Maria-San Luis Obispo | Central Coast California |
| 124 | Lafayette, LA | Acadiana |
| 125 | Bakersfield | Southern San Joaquin Valley |
| 126 | Wilmington, NC | Coastal North Carolina |
| 127 | Columbus, GA-Opelika, AL | West Georgia / East Alabama |
| 128 | Monterey-Salinas | Monterey Bay |
| 129 | La Crosse-Eau Claire | Western Wisconsin |
| 130 | Corpus Christi | Coastal South Texas |
| 131 | Salisbury | Delmarva |
| 132 | Amarillo | Texas Panhandle |
| 133 | Wausau-Rhinelander | Northern Wisconsin |
| 134 | Columbus-Tupelo-West Point-Houston | Northeastern Mississippi |
| 135 | Columbia-Jefferson City | Central Missouri |
| 136 | Chico-Redding | Northern California |
| 137 | Rockford | Northern Illinois |
| 138 | Duluth-Superior | Northern Minnesota / Northwestern Wisconsin |
| 139 | Medford-Klamath Falls | Southern Oregon / Northern California |
| 140 | Lubbock | West Texas |
| 141 | Topeka | Northeastern Kansas |
| 142 | Monroe-El Dorado | Northeastern Louisiana / Southern Arkansas |
| 143 | Beaumont-Port Arthur | Southeast Texas |
| 144 | Odessa-Midland | Permian Basin |
| 145 | Palm Springs | Coachella Valley |
| 146 | Anchorage | Southcentral Alaska |
| 147 | Minot-Bismarck-Dickinson (Williston) | Western North Dakota |
| 148 | Panama City | Florida Panhandle |
| 149 | Sioux City | Northwestern Iowa |
| 150 | Wichita Falls-Lawton | North Texas / Southwest Oklahoma |
| 151 | Joplin-Pittsburg | Four-State Area |
| 152 | Albany, GA | Southwest Georgia |
| 153 | Rochester-Mason City-Austin | Southern Minnesota |
| 154 | Erie | Northwestern Pennsylvania |
| 155 | Idaho Falls-Pocatello (Jackson) | Eastern Idaho |
| 156 | Bangor | Northern Maine |
| 157 | Gainesville | North-Central Florida |
| 158 | Biloxi-Gulfport | Mississippi Gulf Coast |
| 159 | Terre Haute | Western Indiana |
| 160 | Sherman-Ada | North Texas / Southern Oklahoma |
| 161 | Missoula | Western Montana |
| 162 | Binghamton | Southern Tier New York / Northern Pennsylvania |
| 163 | Wheeling-Steubenville | Ohio Valley |
| 164 | Yuma-El Centro | Southwest Arizona / Imperial Valley |
| 165 | Billings | Eastern Montana |
| 166 | Abilene-Sweetwater | West-Central Texas |
| 167 | Bluefield-Beckley-Oak Hill | Southern West Virginia |
| 168 | Hattiesburg-Laurel | Southern Mississippi |
| 169 | Rapid City | Western South Dakota |
| 170 | Dothan | Southeast Alabama |
| 171 | Utica | Central New York |
| 172 | Clarksburg-Weston | North-Central West Virginia |
| 173 | Harrisonburg | Shenandoah Valley |
| 174 | Jackson, TN | West Tennessee |
| 175 | Quincy-Hannibal-Keokuk | Tri-State Area |
| 176 | Charlottesville | Central Virginia |
| 177 | Lake Charles | Southwest Louisiana |
| 178 | Elmira (Corning) | Southern Tier New York |
| 179 | Watertown | Northern New York |
| 180 | Bowling Green | South-Central Kentucky |
| 181 | Marquette | Upper Peninsula of Michigan |
| 182 | Jonesboro | Northeastern Arkansas |
| 183 | Alexandria, LA | Central Louisiana |
| 184 | Laredo | South Texas |
| 185 | Butte-Bozeman | Southwestern Montana |
| 186 | Bend | Central Oregon |
| 187 | Grand Junction-Montrose | Western Colorado |
| 188 | Twin Falls | Southern Idaho |
| 189 | Lafayette, IN | Northwestern Indiana |
| 190 | Lima | Northwestern Ohio |
| 191 | Great Falls | North-Central Montana |
| 192 | Meridian | East-Central Mississippi |
| 193 | Cheyenne-Scottsbluff | Southeast Wyoming / Western Nebraska |
| 194 | Parkersburg | Mid-Ohio Valley |
| 195 | Greenwood-Greenville | Mississippi Delta |
| 196 | Eureka | Northern California Coast |
| 197 | San Angelo | West-Central Texas |
| 198 | Casper-Riverton | Central Wyoming |
| 199 | Mankato | Southern Minnesota |
| 200 | Ottumwa-Kirksville | Southeast Iowa / Northeast Missouri |
| 201 | St. Joseph | Northwestern Missouri |
| 202 | Fairbanks | Interior Alaska |
| 203 | Zanesville | Eastern Ohio |
| 204 | Victoria | South Texas |
| 205 | Helena | Western / Central Montana |
| 206 | Presque Isle | Northern Maine |
| 207 | Juneau | Southeast Alaska |
| 208 | Alpena | Northeastern Michigan |
| 209 | North Platte | Western Nebraska |
| 210 | Glendive | Eastern Montana |
Note: DMA market names, rankings, boundaries, and geographic assignments can change over time. For location-specific research, verify the applicable market against the latest available Nielsen DMA data.
The 2025–26 ranking above is supported by the published 2025–26 market list for ranks 1–200 and the current 2026 RTDNA market-size list for ranks 201–210.
Note: This table is a market-ranking reference, not a substitute for Nielsen’s proprietary DMA boundary or ZIP Code data. Nielsen states that its DMA boundaries and data are proprietary and that its ZIP-by-DMA, household estimates, demographic rankings, shapefiles, and full DMA map are licensed data products.
What Is My Designated Market Area?
If you are wondering “What is my DMA?”, you generally need to start with your location.
Useful information includes:
- City
- State
- County
- ZIP Code
Your location can then be matched to the corresponding DMA region.
For example:
Your ZIP Code
→ County
→ DMA Region
→ Local Television Market
This is why DMA lookup tools and ZIP Code databases are useful for marketers, researchers, advertisers, and businesses.
Nielsen’s ZIP Code by DMA data specifically provides ZIP Code listings within U.S. counties by DMA region and is updated annually.
Find Your Designated Market Area
Enter your City, State, County, or ZIP Code to look up the DMA associated with your location.
Enter your city, state, county, or ZIP Code to find the Designated Market Area (DMA) for your location.
ZIP Code is not the same as a DMA. A ZIP Code identifies a postal area, while a DMA identifies a local television market.
Can You Find Your DMA by ZIP Code?
Yes. A ZIP Code is one of the most practical ways to identify the DMA associated with a specific location.
However, a ZIP Code is not the same as a DMA. A ZIP Code identifies a postal area, while a DMA identifies a local television market.
🔎 What DMA Am I In?
If you’re looking for the DMA associated with your specific ZIP Code, use our DMA Lookup by ZIP Code to learn how to find your local television market.
The guide explains how ZIP Codes are matched to DMA regions, what a Nielsen DMA is, and how to verify your DMA using current data.
The relationship is:
ZIP Code → Geographic Location → DMA
rather than:
ZIP Code = DMA
Nielsen maintains ZIP Code-to-DMA data that connects U.S. ZIP Codes with their corresponding DMA regions.
This distinction is especially important for businesses using geographic targeting, local advertising, media buying, or audience research.
Designated Market Area List
A DMA list contains the local television markets used in the Nielsen system. The United States is divided into 210 DMA regions, with each market covering a defined geographic area.
Some of the largest and most recognizable U.S. television markets include:
| DMA Market | Major City or Area |
|---|---|
| New York | New York metropolitan area |
| Los Angeles | Los Angeles area |
| Chicago | Chicago area |
| Philadelphia | Philadelphia area |
| Dallas-Fort Worth | Dallas-Fort Worth area |
| Houston | Houston area |
| Washington, DC | Washington, DC area |
| San Francisco-Oakland-San Jose | San Francisco Bay Area |
| Boston | Boston area |
| Atlanta | Atlanta area |
The name of a DMA usually refers to its primary or best-known market, but the actual geographic area can extend beyond that city. A DMA may include surrounding counties, smaller cities, suburbs, and communities that belong to the same local television market.
For a complete DMA list, use the latest available Nielsen data to verify current market names, geographic boundaries, and DMA assignments.
Designated Market Area Rankings
DMA rankings compare U.S. television markets using measures such as television households, population, demographics, and other market characteristics.
One common ranking method uses television household estimates. Nielsen also publishes DMA market and demographic data covering different household and audience categories.
The largest U.S. television markets commonly include:
- New York
- Los Angeles
- Chicago
- Philadelphia
- Dallas-Fort Worth
However, the meaning of a DMA ranking depends on the metric and dataset being used. A ranking based on television households may produce different results from one based on population or another audience measurement.
Common DMA ranking metrics include:
- Television households
- Population
- Household demographics
- Market penetration
- Audience characteristics
- Other local market measurements
For advertising and media planning, market size alone does not determine whether a DMA fits a particular campaign. Advertisers may also consider audience demographics, consumer behavior, campaign objectives, geographic coverage, and budget.
Designated Market Area Rankings: 2025–2026
The 2025–2026 Nielsen DMA rankings list the 210 designated market areas in the United States by market rank. The ranking is used to compare the relative size of local television markets across the country.
New York, Los Angeles, and Chicago remain the top three DMA markets, followed by Dallas-Fort Worth and Philadelphia. The complete ranking below covers all 210 U.S. DMA markets.
| Rank | DMA Market | Market Area |
|---|---|---|
| 1 | New York | New York metropolitan area |
| 2 | Los Angeles | Los Angeles area |
| 3 | Chicago | Chicago area |
| 4 | Dallas-Fort Worth | Dallas-Fort Worth area |
| 5 | Philadelphia | Philadelphia area |
| 6 | Houston | Houston area |
| 7 | Atlanta | Atlanta area |
| 8 | Washington, D.C. (Hagerstown) | Washington, D.C. area |
| 9 | San Francisco-Oakland-San Jose | San Francisco Bay Area |
| 10 | Boston (Manchester) | Boston area |
| 11 | Tampa-St. Petersburg (Sarasota) | Tampa Bay area |
| 12 | Phoenix (Prescott) | Phoenix area |
| 13 | Seattle-Tacoma | Seattle area |
| 14 | Detroit | Detroit area |
| 15 | Orlando-Daytona Beach-Melbourne | Central Florida |
| 16 | Minneapolis-St. Paul | Twin Cities area |
| 17 | Denver | Denver area |
| 18 | Miami-Fort Lauderdale | South Florida |
| 19 | Cleveland-Akron (Canton) | Northeast Ohio |
| 20 | Sacramento-Stockton-Modesto | Central California |
| 21 | Charlotte | Charlotte area |
| 22 | Raleigh-Durham (Fayetteville) | Research Triangle |
| 23 | Portland, OR | Portland area |
| 24 | St. Louis | St. Louis area |
| 25 | Nashville | Nashville area |
| 26 | Indianapolis | Indianapolis area |
| 27 | Pittsburgh | Pittsburgh area |
| 28 | Salt Lake City | Utah and surrounding area |
| 29 | Baltimore | Baltimore area |
| 30 | San Diego | San Diego area |
| 31 | San Antonio | San Antonio area |
| 32 | Kansas City | Kansas City area |
| 33 | Hartford-New Haven | Connecticut area |
| 34 | Austin | Austin area |
| 35 | Columbus, OH | Columbus area |
| 36 | Greenville-Spartanburg-Asheville-Anderson | Upstate South Carolina / Western North Carolina |
| 37 | Cincinnati | Cincinnati area |
| 38 | Milwaukee | Milwaukee area |
| 39 | West Palm Beach-Fort Pierce | South Florida |
| 40 | Las Vegas | Las Vegas area |
| 41 | Jacksonville | Northeast Florida |
| 42 | Harrisburg-Lancaster-Lebanon-York | South-Central Pennsylvania |
| 43 | Grand Rapids-Kalamazoo-Battle Creek | West Michigan |
| 44 | Norfolk-Portsmouth-Newport News | Hampton Roads |
| 45 | Birmingham (Anniston and Tuscaloosa) | Central Alabama |
| 46 | Greensboro-High Point-Winston-Salem | Piedmont Triad |
| 47 | Oklahoma City | Central Oklahoma |
| 48 | Albuquerque-Santa Fe | New Mexico |
| 49 | Louisville | Louisville area |
| 50 | New Orleans | New Orleans area |
| ZIP Code | DMA |
|---|---|
| Postal geography | Media geography |
| Used for mail and location | Used for television markets |
| Identifies a postal area | Identifies a local TV market |
| Can be used to find a DMA | Can contain many ZIP Codes |
A ZIP Code can therefore be used as an input for a DMA lookup, but the ZIP Code itself is not the DMA.
The basic relationship is:
ZIP Code → Location → DMA
Nielsen’s ZIP Code-to-DMA data connects ZIP Codes with their corresponding DMA regions, making ZIP Code one of the most practical starting points for identifying a local television market.
DMA vs. Metro Area: What’s the Difference?
A DMA and a metro area are different geographic classifications used for different purposes.
A metro area generally describes the population and economic relationship between a central city and surrounding communities.
A DMA describes a local television market based on television viewing patterns.
Because they are based on different criteria, their geographic boundaries do not necessarily match.
| DMA | Metro Area |
|---|---|
| Television market | Metropolitan area |
| Based on TV viewing | Based on population and economic relationships |
| Used for television measurement and media planning | Used for population, economic, and geographic analysis |
| Defined through the Nielsen DMA system | Defined through metropolitan geographic classifications |
For television advertising and local TV audience measurement, the DMA is the relevant geographic classification.
Why DMA Matters for Local Marketing
DMA data helps businesses understand audiences at the regional television-market level.
For example, a national advertiser can divide a campaign into multiple DMA regions instead of treating the entire United States as a single market.
This allows marketers to compare markets based on:
- Audience size
- Household characteristics
- Demographics
- Television viewing
- Local market conditions
- Advertising reach
DMA data can also be combined with ZIP Code, county, demographic, and audience information to analyze where specific television markets are located and how they differ.
For businesses planning local or regional campaigns, understanding the DMA associated with a location can provide a more relevant television-market view than using a city or ZIP Code alone.
Are DMA Boundaries the Same Every Year?
Not necessarily.
Nielsen periodically reviews DMA regions, and the counties assigned to a market can change as television viewing patterns and market conditions change.
This means an older DMA map, market list, ZIP Code lookup, or county-to-DMA database may not accurately reflect current market assignments.
When using DMA data for advertising, media buying, audience research, or geographic analysis, always check:
- The publication or data year
- The source of the DMA data
- Whether the market boundaries are current
- Whether ZIP Code and county assignments have been updated
For location-specific research, using the most current available DMA data is especially important because an outdated geographic assignment could place a ZIP Code or county in the wrong television market.
What Is a DMA Code?
A DMA code is a numerical identifier used to represent a designated market area in certain advertising, media, analytics, and geographic datasets.
Instead of identifying a market only by name, a DMA code provides a numerical value that can be used by databases and software systems.
DMA codes may appear in:
- Advertising platforms
- Audience databases
- Marketing datasets
- Analytics systems
- Media planning tools
- Geographic targeting data
A DMA code is not the same as a ZIP Code.
| DMA Code | ZIP Code |
|---|---|
| Identifies a media market | Identifies a postal area |
| Associated with a DMA | Associated with a geographic mailing area |
| Used in media and geographic datasets | Used for addresses and location data |
| One DMA can include many ZIP Codes | A ZIP Code can be mapped to a DMA |
In practical terms:
ZIP Code → identifies the location
DMA code → identifies the television market
When working with DMA codes, check which coding system and data source are being used rather than assuming that every platform uses the same identifier.
Frequently Asked Questions
What does DMA stand for?
DMA stands for Designated Market Area.
What is a Designated Market Area?
A Designated Market Area (DMA) is a geographic region used to represent a local television market in the United States.
Who defines DMA regions?
DMA regions are defined and owned by Nielsen as part of its television market geography.
How many DMA regions are there?
There are currently 210 DMA regions in the Nielsen system.
How do I find my DMA?
You can identify your DMA using your ZIP Code, city, or county and matching the location to the applicable DMA region.
For the most accurate result, use current DMA data because geographic assignments can change over time.
Can I find my DMA using my ZIP Code?
Yes. A ZIP Code can be used to identify the corresponding DMA, although a ZIP Code and DMA represent different types of geography.
The basic relationship is:
ZIP Code → Location → DMA
Is a DMA the same as a city?
No. A DMA is a television market, while a city is a geographic and governmental area.
A single DMA can include multiple cities, counties, suburbs, and rural communities.
Is a DMA the same as a ZIP Code?
No. A ZIP Code identifies a postal area, while a DMA identifies a local television market.
A DMA can contain many ZIP Codes.
Is a DMA the same as a metro area?
No. A DMA represents a local television market based on television viewing patterns, while a metro area represents a metropolitan population and economic area.
Their geographic boundaries do not necessarily match.
What is a DMA map?
A DMA map shows the geographic boundaries of U.S. local television markets and can help identify which DMA covers a particular area.
What is a DMA code?
A DMA code is a numerical identifier associated with a designated market area in certain media, advertising, analytics, and geographic datasets.
It should not be confused with a ZIP Code.
What are DMA rankings?
DMA rankings compare television markets using measurements such as television households, population, demographics, or other market data.
The ranking can vary depending on the metric and dataset being used.
Why are DMA regions important to advertisers?
DMA regions provide a standardized way for advertisers and media buyers to organize campaigns around local television markets, compare audiences, and analyze geographic markets.
Do DMA boundaries change?
They can. Nielsen may revise DMA geographic assignments as television viewing patterns and market conditions change.
When using a DMA map, list, ranking, or lookup, check the data source and publication year to make sure the information reflects the applicable market definitions.
Bottom Line
A Designated Market Area (DMA) is a standardized U.S. television-market geography defined by Nielsen. It identifies the local television market associated with a particular geographic area and is widely used for television audience measurement, advertising, media buying, market research, and geographic analysis.
The easiest way to understand the system is:
Location → ZIP Code / County → DMA Region → Local Television Market
A DMA is different from a city, ZIP Code, county, state, or metropolitan area because it is specifically designed around local television viewing and media markets. One DMA can include multiple cities, counties, suburbs, rural communities, and thousands of ZIP Codes.
There are currently 210 DMA regions in the Nielsen system, covering the continental United States, Hawaii, and parts of Alaska. Because DMA boundaries and geographic assignments can change, the data source and publication year should always be checked when using a DMA map, list, ranking, or lookup.
If you’re trying to find your specific DMA, a ZIP Code is one of the most practical starting points. You can use your ZIP Code, city, or county to identify the corresponding DMA, then check the market name, DMA code, geographic coverage, and applicable ranking data.
DMA information is particularly useful when you need to:
- Find the local television market for a ZIP Code or county
- Understand U.S. DMA map boundaries
- Look up a specific DMA market
- Compare DMA rankings
- Identify a DMA code
- Determine which counties and ZIP Codes belong to a market
- Plan local or regional television advertising
- Analyze audiences and demographics by television market
- Compare DMA geography with ZIP Codes, counties, metro areas, and other geographic classifications
- Work with DMA data in advertising, analytics, research, and media planning
When using third-party DMA lists or lookup tools, verify that the information comes from a reliable source and reflects the appropriate Nielsen data year. An older DMA assignment may not reflect the current geographic definition.
For a specific location, start with the ZIP Code lookup, then use the DMA market, code, map, rankings, and geographic information to understand the full television market associated with that location.
If you already know your ZIP Code and simply want to find the corresponding television market, see our DMA Lookup by ZIP Code guide.